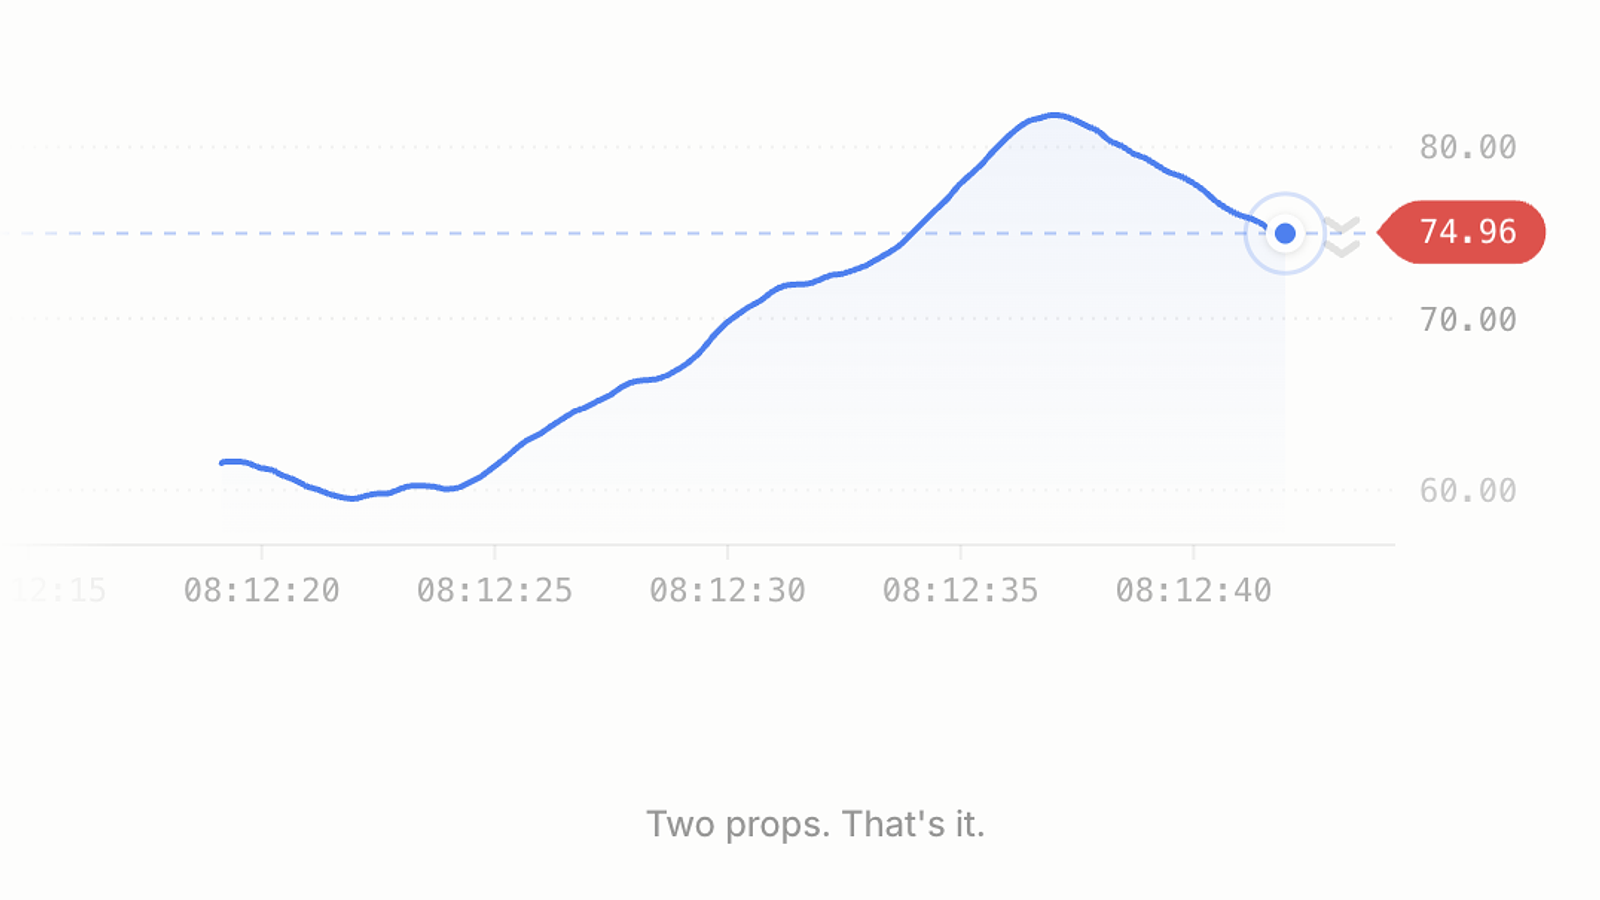
Real-time animated charts for React. Line, multi-series, and candlestick modes, canvas-rendered, 60fps, zero CSS imports.
Install
pnpm add livelinePeer dependency: react >=18.
Quick Start
import { Liveline } from 'liveline'
import type { LivelinePoint } from 'liveline'

function Chart() {
  const [data, setData] = useState<LivelinePoint[]>([])
  const [value, setValue] = useState(0)

  // Feed data from WebSocket, polling, etc.
  // Each point: { time: unixSeconds, value: number }

  return (
    <div style={{ height: 300 }}>
      <Liveline data={data} value={value} color="#3b82f6" theme="dark" />
    </div>
  )
}
The component fills its parent container. Set a height on the parent. Pass data as a growing array of points and value as the latest number — Liveline handles smooth interpolation between updates.