
Introduction
Beautiful, modern UI components for React applications.
Bklit UI is a component library built on top of shadcn/ui to help you build charts and data visualizations more easily.
Usage
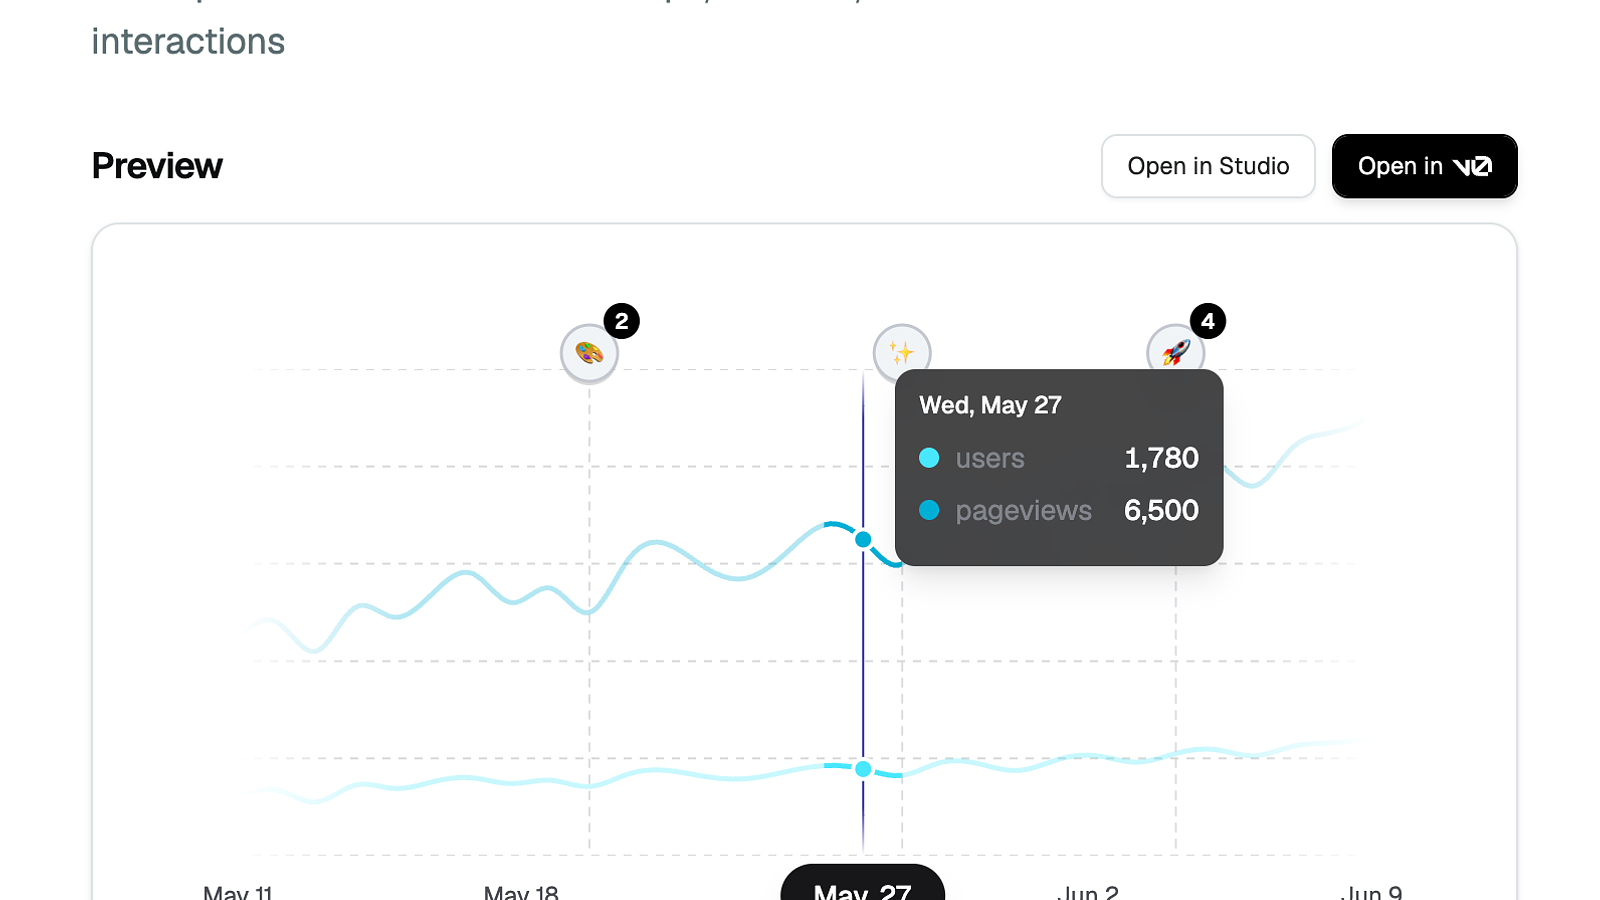
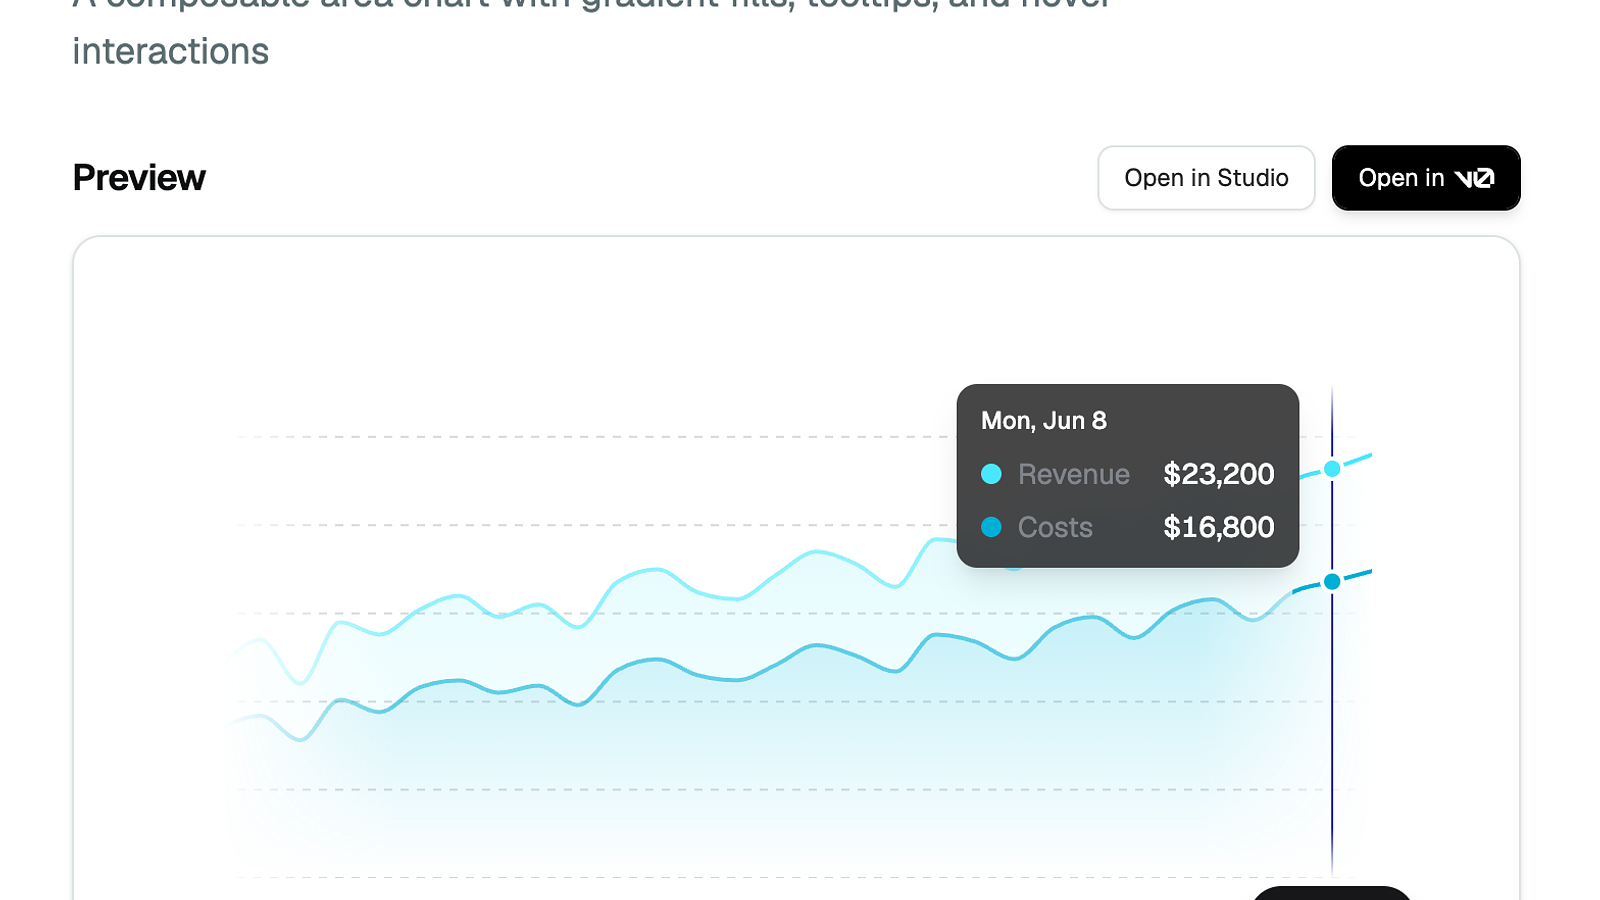
The Area Chart uses the same composable API as the Line Chart. See the charts gallery for interactive examples.
import { AreaChart, Area, Grid, XAxis, ChartTooltip } from "@bklitui/ui/charts";

const data = [
  { date: new Date("2025-01-01"), revenue: 12000, costs: 8500 },
  { date: new Date("2025-01-02"), revenue: 13500, costs: 9200 },
  // ... more data
];

export default function RevenueChart() {
  return (
    <AreaChart data={data}>
      <Grid horizontal />
      <Area dataKey="revenue" fill="var(--chart-line-primary)" />
      <Area dataKey="costs" fill="var(--chart-line-secondary)" />
      <XAxis />
      <ChartTooltip />
    </AreaChart>
  );
}